.png)
Public Sector Demographics
January Quarter, 2024. Next update April 2024
1. Public Sector Overview
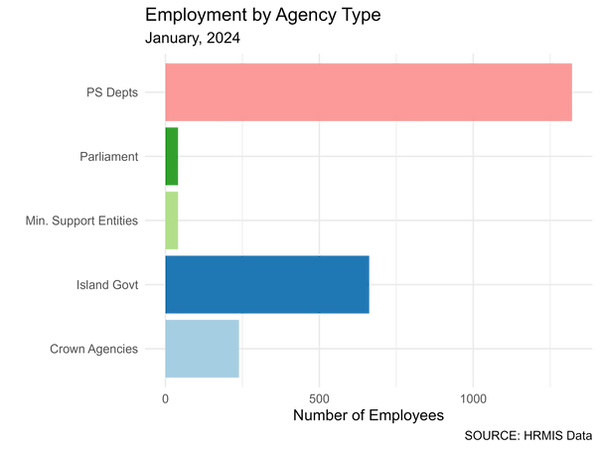
As of the 31th of March 2024, there were a total of 2,323 employees working for government. This is a slight increase of 19 employees since the quarter. The majority of public servants work in the Public Sector (57%) with a further 29% working for Island Government. The remaining 14% are spread throughout the Crown Agencies (10%), Parliament (2%) and Minister Support Entities (2%)

Mean and median are two common measures used to interpret the average salaries in the public sector. These measures provide valuable information about the distribution of salaries between agencies and can help to identify trends and disparities in the data.
The mean is calculated by adding up all of the salary values in a given dataset and dividing by the total number of employees. It provides a good indication of the typical salary in an agency (group) and is useful for summarizing large amounts of data like individual salaries. However, the mean can be sensitive to extremely high salaries (outliers) and may not accurately reflect the average salary if there are high salaries in the data.
The median, on the other hand, is the value that separates the higher half of a dataset from the lower half. It is a more robust measure of salary averages and is less influenced by outliers like very high salaries, which is why it was chosen for most tables displaying averages.
The average worker in the Public Sector, Crown Agencies and Minister Support Entities make roughly $30,000 annually while the average worker in the Outer Islands makes slightly above $15,000. Parliament has the highest median salary, above $70,000 each year, which is made up of Civil List and House of Ariki.

2. Work and Employee Status
Most of government employees (76%) are full-time workers while the remaining 24% are comprised of Temporary full-time (3%), causal (8%) and part-time workers (13%).

Furthermore, the vast majority of employees, 90%, are Cook Islanders, with the remainder documented as Work Permit Holders (9%) and Permanent Resident Holders (1%).
3. Public Sector Gender and Age Demographics
The gender distribution in Government shows slightly more women (53%) working in the sector, with men making up 47%.
Some areas, such as Crown agencies (50.6% females) and Minister Support Entities (48.8% females), have a more balanced gender workforce, while others, such as the 14 Public Sector Agencies (64.7% females) and Parliament (73.2% males) and Island Government (70.1% males), are predominantly composed of one gender.


In general, there are more females than males in the younger age groups, with 51.6% of employees in the 20 or less age group being female, and the highest percentage of females in the 31-40 age group at 58.4%. However, in the older age groups, the percentage of males is higher, with 53.77% of employees in the 51-60 age group being male, and the highest percentage of males in the 71-80+ age group at 50.85%.

4. Agency Demographics
In terms of agency size, the Ministry of Education has the largest number of employees, with 413 or 18% of the total workforce. The Ministry of Health comes in second with 349 employees or 15%. The smallest agencies are the Natural Heritage and Financial Service Development, both with only one or two employees.
In terms of average salary ranges, the Civil List in Parliament has the highest median salary of $72,500, followed by the Office of the Public Service Commissioner with $49,121 and the Crown Law Office with $50,000. The lowest median salaries are found in the Island Governments with an average of $16,425, with the exception of Aitutaki Island Government which has a slight higher median salary of $16,901
The following chart provides a list of Government Agencies along with the number of employees each Agency has in the first column, while the second column displays salary distribution within the agency types.

In general, the larger agencies with more employees tend to have higher median salaries. For example, the Ministry of Education and the Ministry of Finance and Economic Management have more than 100 employees and median salaries in the $30,000 range. The smaller agencies, such as the Island Governments, have fewer than 100 employees and median salaries in the $15,000 range. However, there are exceptions to this trend, such as the Crown Law Office with only 9 employees but a high median salary.
